Case Study
Financial Aid & Retention Dashboard
Interactive tool that quantifies how WGU scholarships impact retention across 931K students and 12 demographic dimensions.
The Challenge
WGU awards scholarships to roughly 5% of its nearly one million students, but the scholarship team had no way to see which students benefit most — or by how much. Population averages masked critical subgroup differences: a $3,000 award has a very different proportional impact on a first-generation student than a non-first-gen student, and a group that looks strong at 7-month retention can diverge sharply by the 36-month mark. The combinatorial space — 12 demographic variables, 6 retention timepoints, 12 scholarship tiers — was too large for spreadsheets or static reports.
The Approach
I built an end-to-end pipeline that takes three institutional source systems (enrollment, demographics, financial aid), deduplicates them to one row per student, cleans and bins 12 independent variables, and computes baselines, subgroup retention rates, and scholarship-by-demographic cross-tabulations. The key metric is proportional impact — (Subgroup Rate − Baseline) / Baseline — which normalizes comparisons across groups with very different base rates.
The pipeline outputs two static CSVs that feed a React + TypeScript frontend with two views: a subpopulation baselines table and a scholarship × demographics heatmap with deviation color-coding. The whole thing ships as a single self-contained HTML file and rebuilds from raw data with one command.
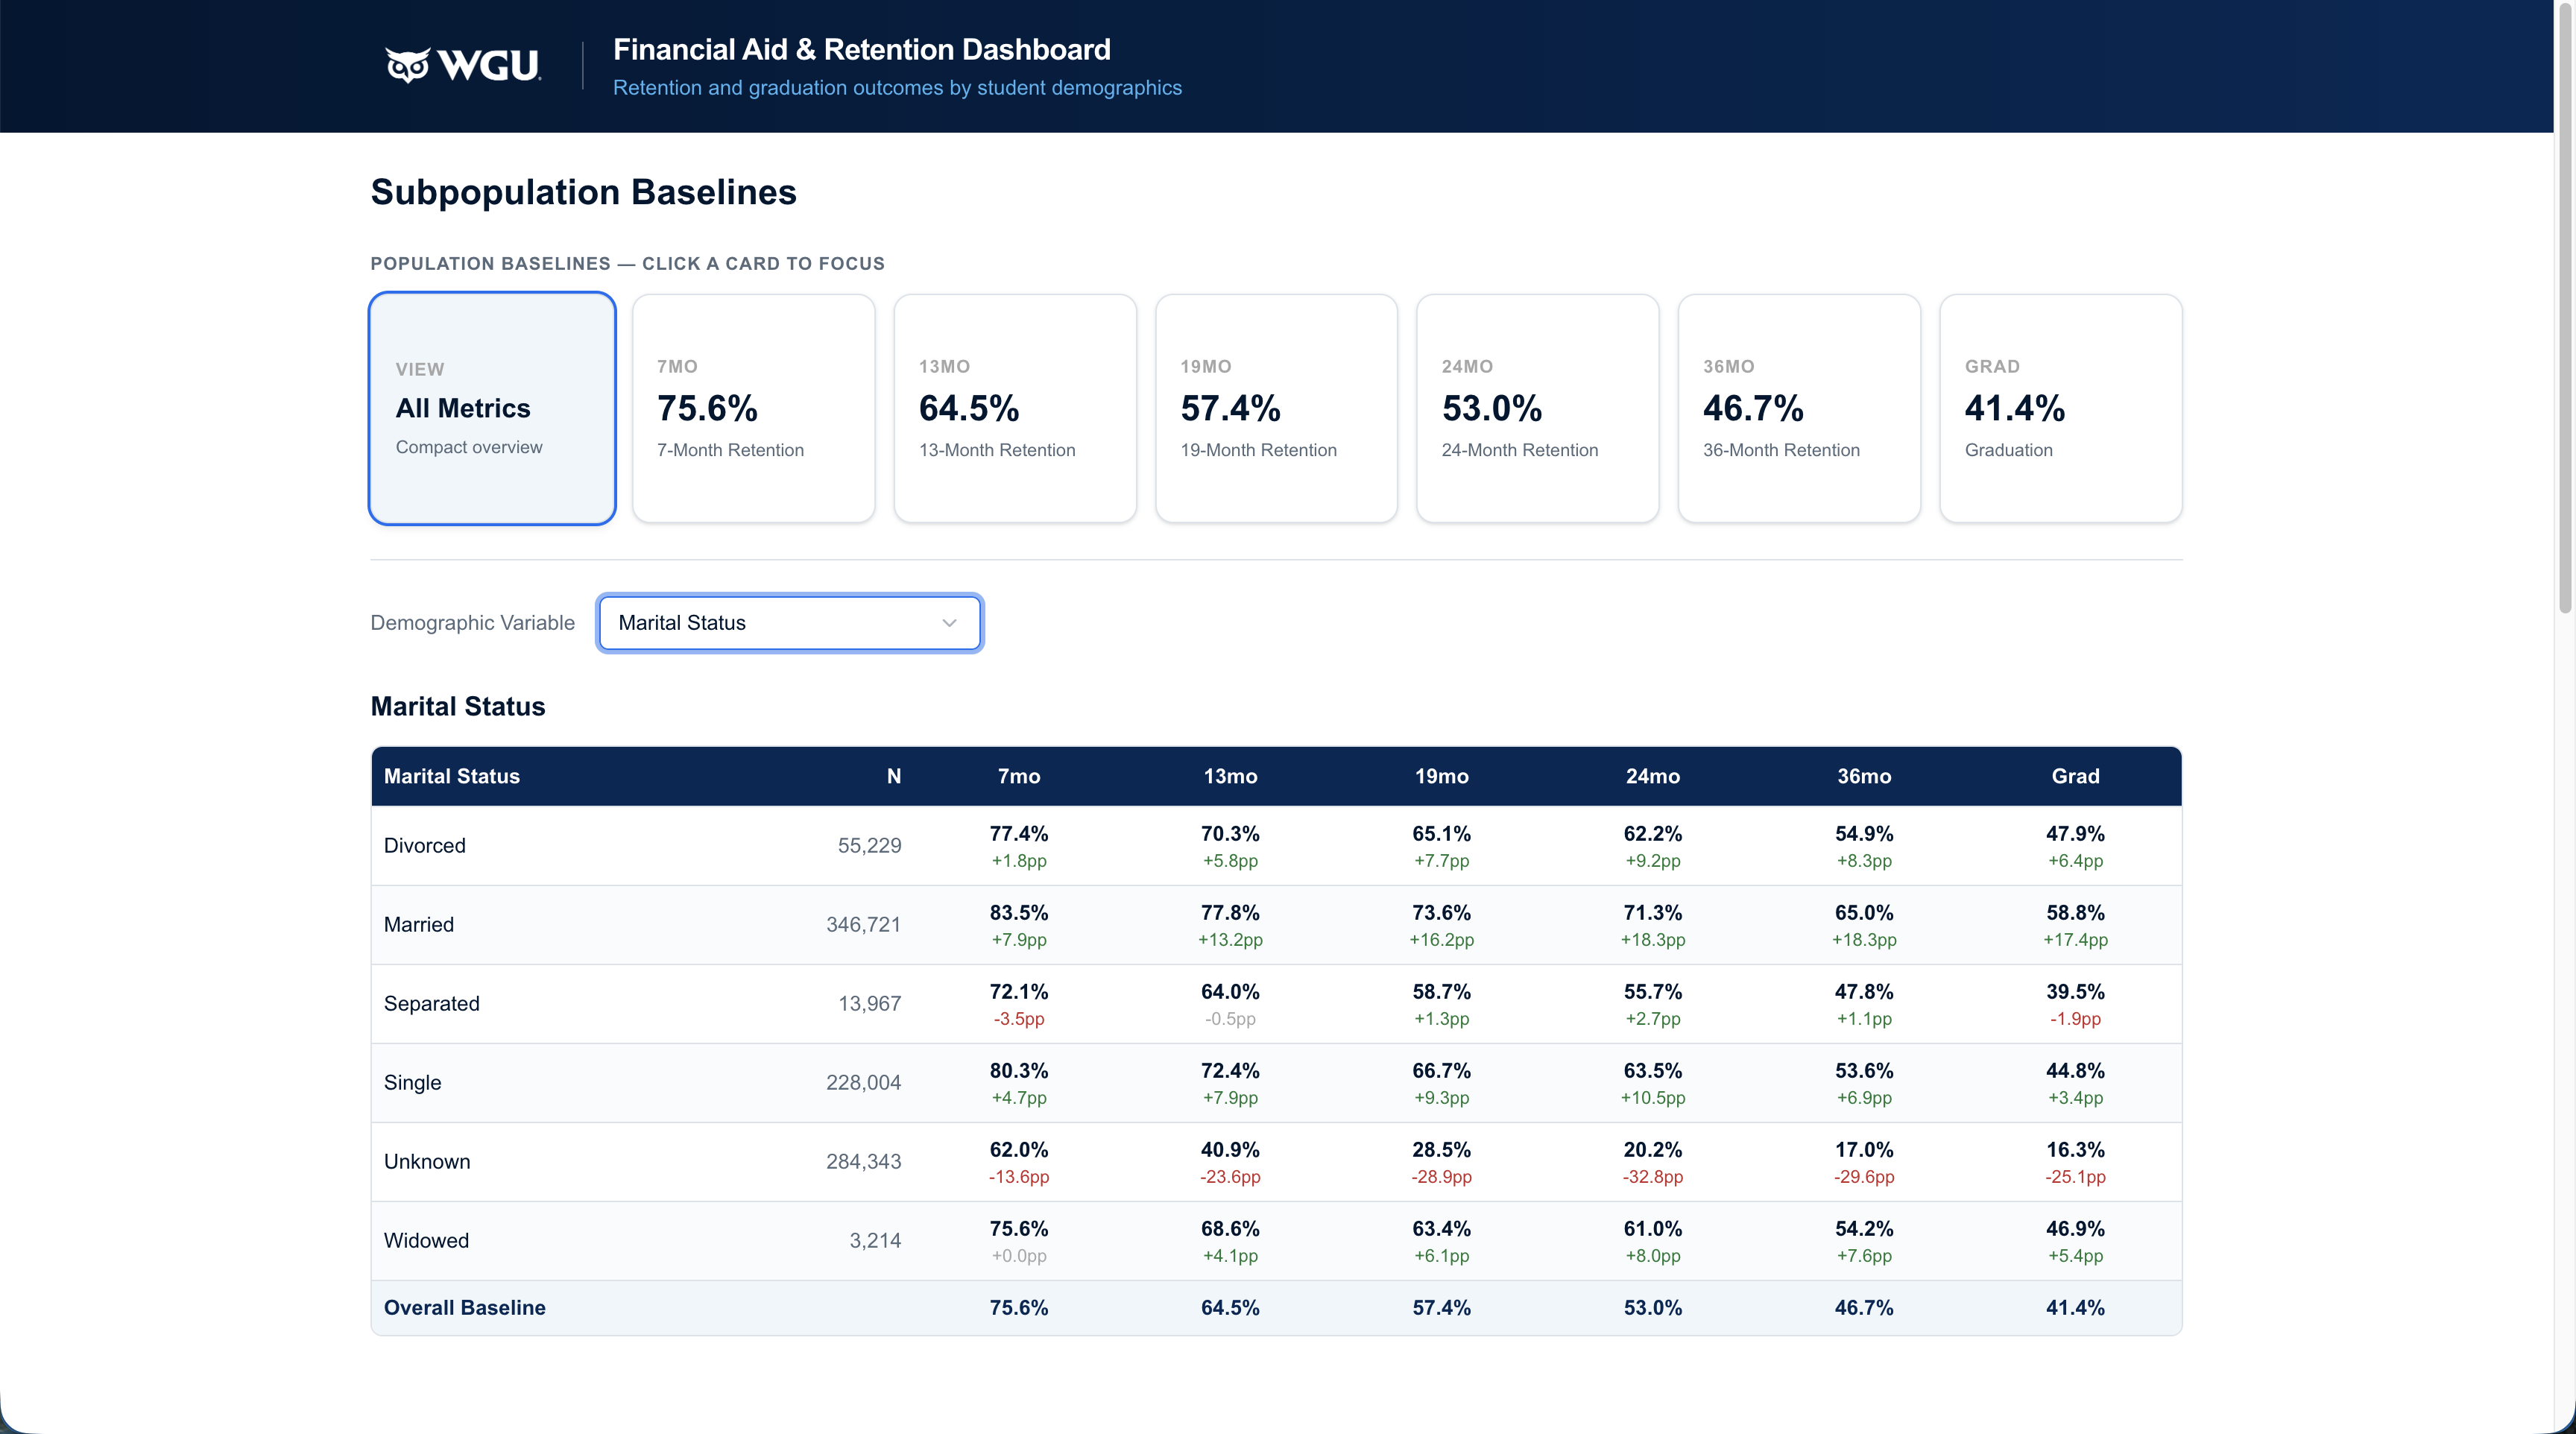
Subpopulation baselines — retention rates sliced by demographic variable with proportional impact indicators
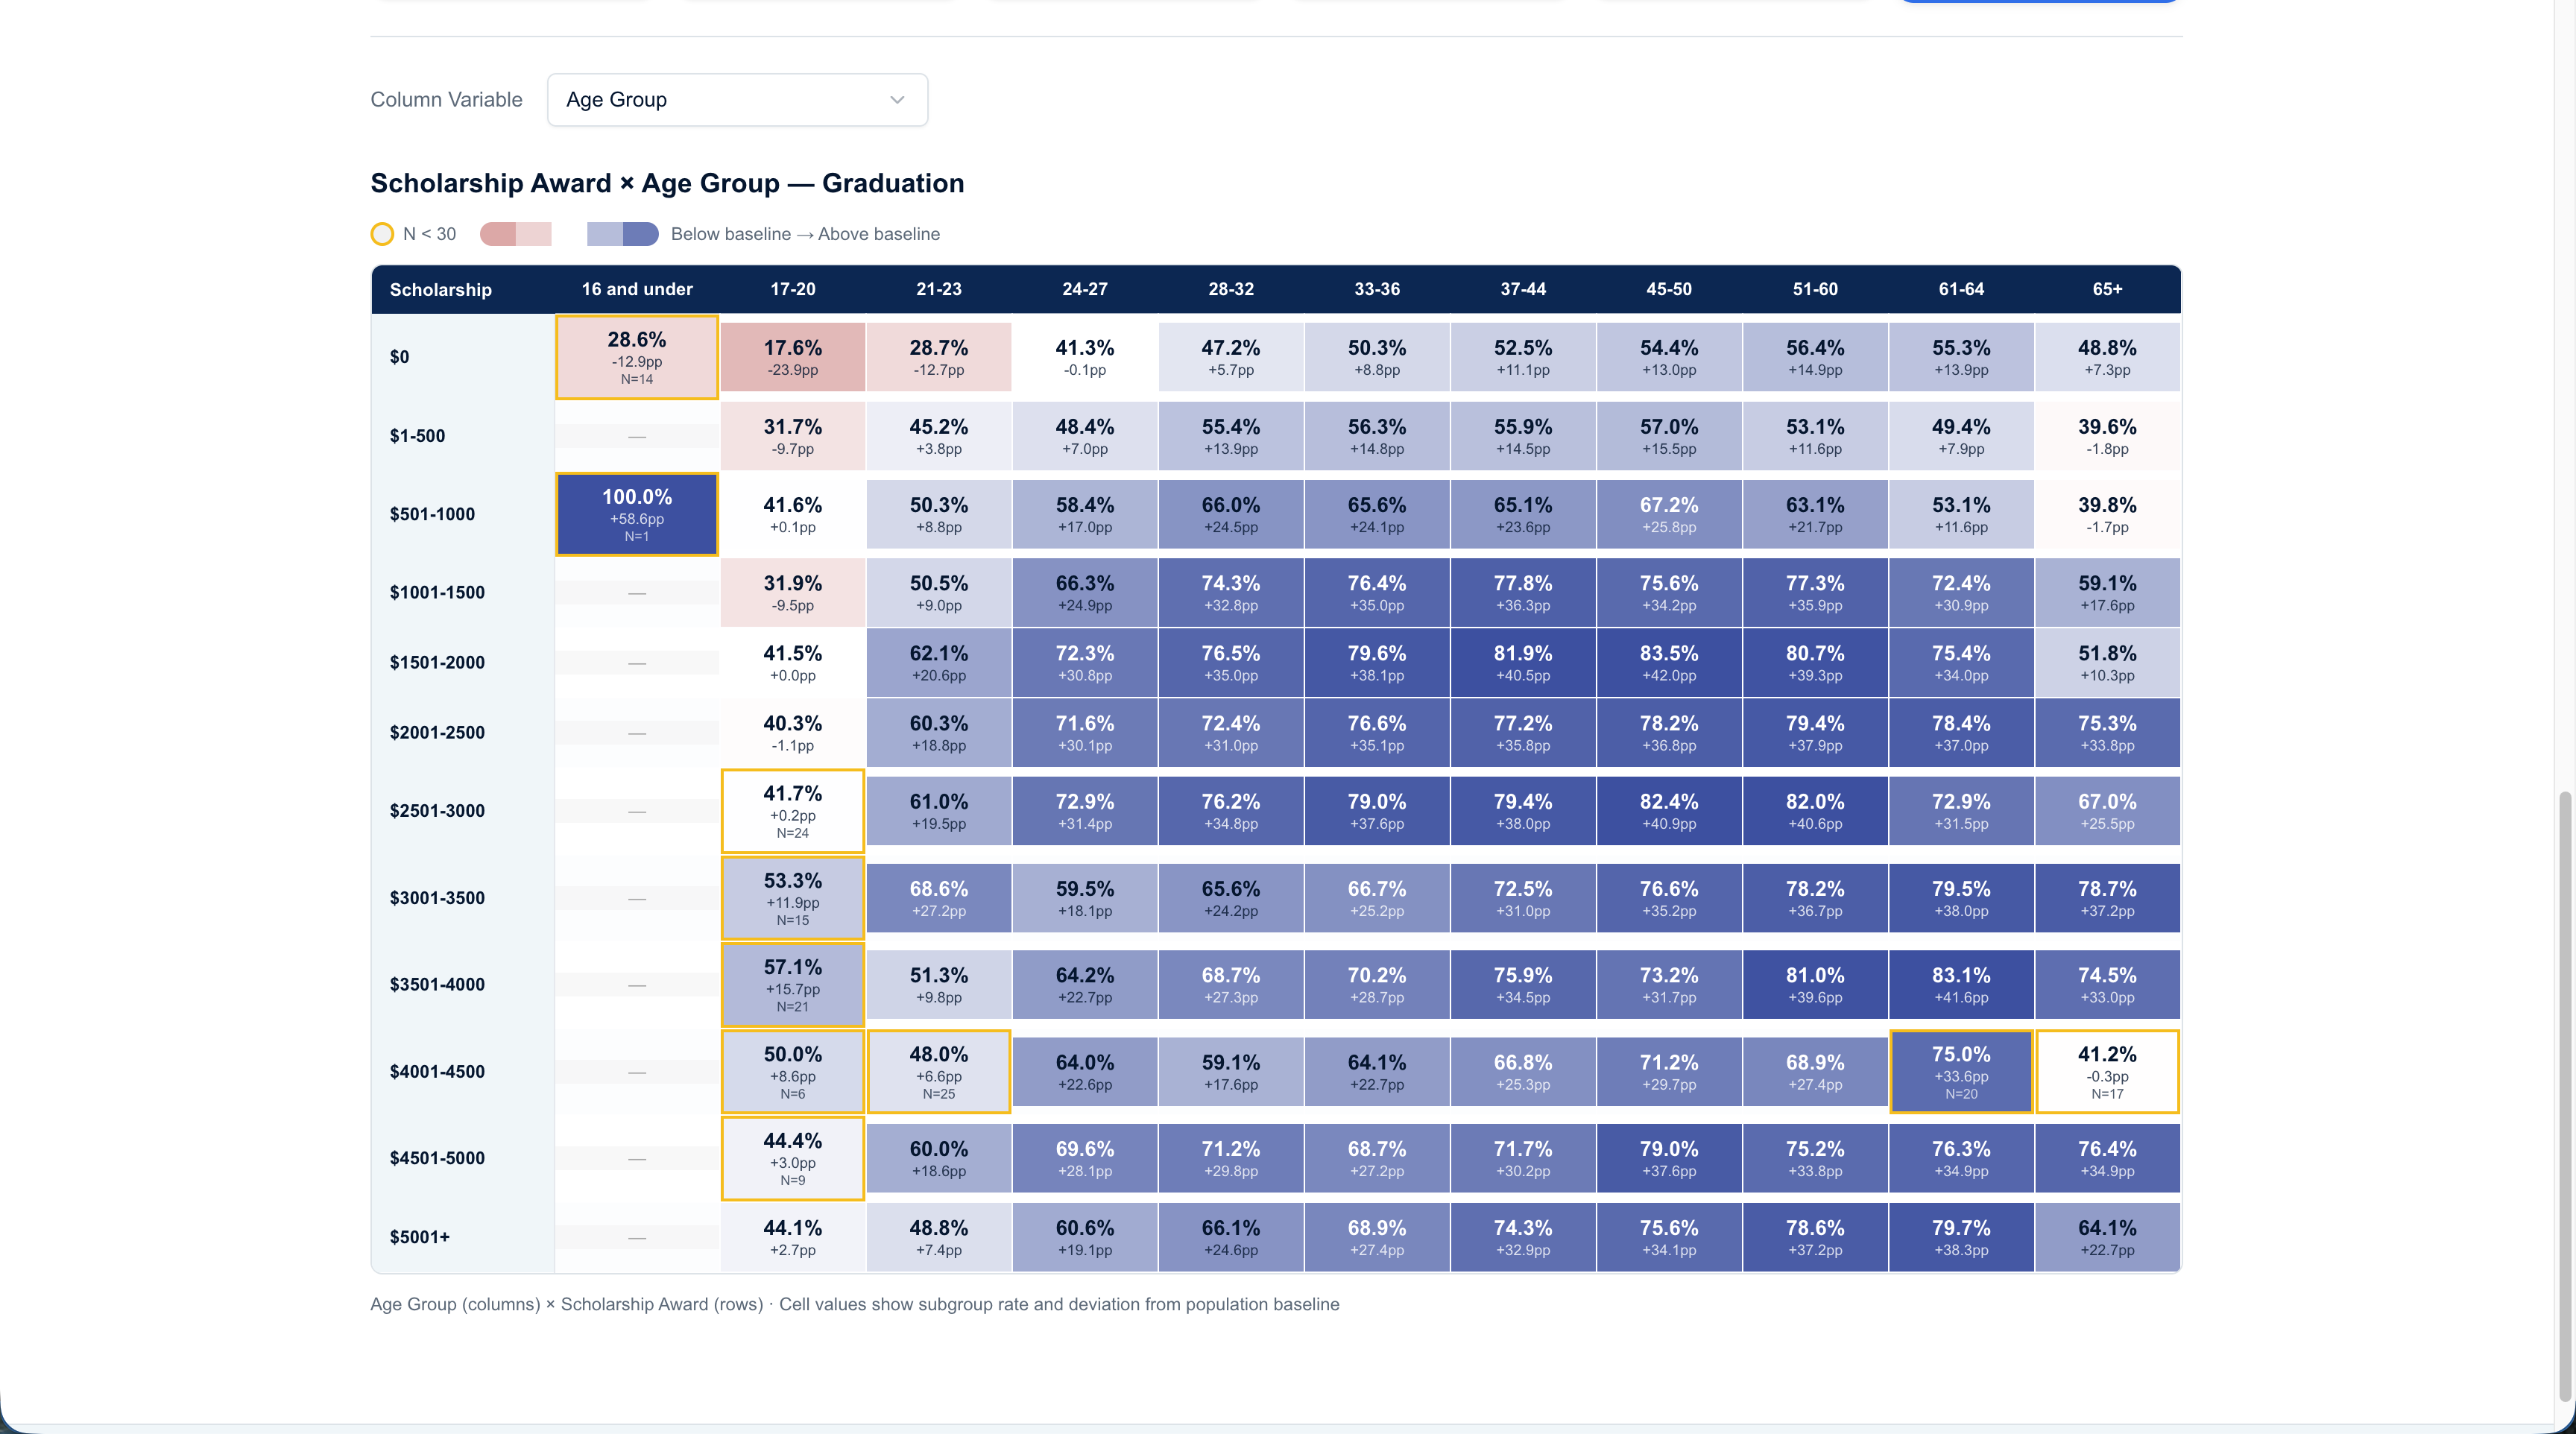
Scholarship × demographics heatmap — deviation from baseline encoded as color, amber rings flag cells with N < 30
Key Results
Any scholarship outperforms no scholarship
The 839K students with $0 in aid drag the baseline down. Every scholarship tier beats it at all six timepoints. At graduation: 39.7% ($0) vs. 41.4% (baseline).
Even $1–500 makes an outsized impact
That tier lifts 7-month retention from 74% to 86% (+13% proportional) and graduation from 39.7% to 50.4% (+22% proportional). The biggest step is from nothing to any award at all.
7-month retention predicts graduation — except for age
Ages 28–32 are #1 at 7 months (86%) but #7 in graduation (49%). Ages 51–60 are #9 at 7 months (77%) but #1 in graduation (58%).
Adopted as a primary decision-making tool
Delivered to senior stakeholders for regular use in scholarship strategy and aid targeting.