Case Study
Financial Advisor Datalake
A nightly ETL pipeline and live advisor dashboard turning two disconnected financial platforms into actionable client intelligence.
The Challenge
The firm ran their practice across two systems — Wealthbox (CRM) and Black Diamond (portfolio management) — with no unified view of client engagement or portfolio risk. Advisors couldn't answer basic questions: Which clients haven't been contacted in 6 months? Where is bank concentration too high in structured note portfolios? The data existed but was siloed behind separate APIs with no shared schema, and the Black Diamond accounts payload alone runs 400MB+.
The Approach
I built an end-to-end data platform on Azure: a Python-based ETL pipeline running as timer-triggered Azure Functions on a nightly schedule, feeding a React dashboard secured with Entra ID. The pipeline follows a medallion architecture — Bronze (raw JSON snapshots to Data Lake), Silver (cleaned and typed Parquet), Gold (bulk MERGE upsert into Azure SQL) — processing Wealthbox and Black Diamond data across 15+ scheduled functions between midnight and 4:45 AM EST.
For the 400MB Black Diamond accounts file, I used streaming JSON parsing with ijson across five separate passes to stay within Azure Functions memory limits. The dashboard is a read-only Express + React app with 13 API routes serving two audiences: a main advisor dashboard (stale client alerts, engagement heatmaps, client segmentation, outreach calendar, client dossier with AI summaries) and a specialized POPS dashboard for the structured notes team (concentration alerts, trade scenario planning across 98 accounts and ~2,100 holdings). A hard rule throughout: the dashboard never writes to existing pipeline tables.
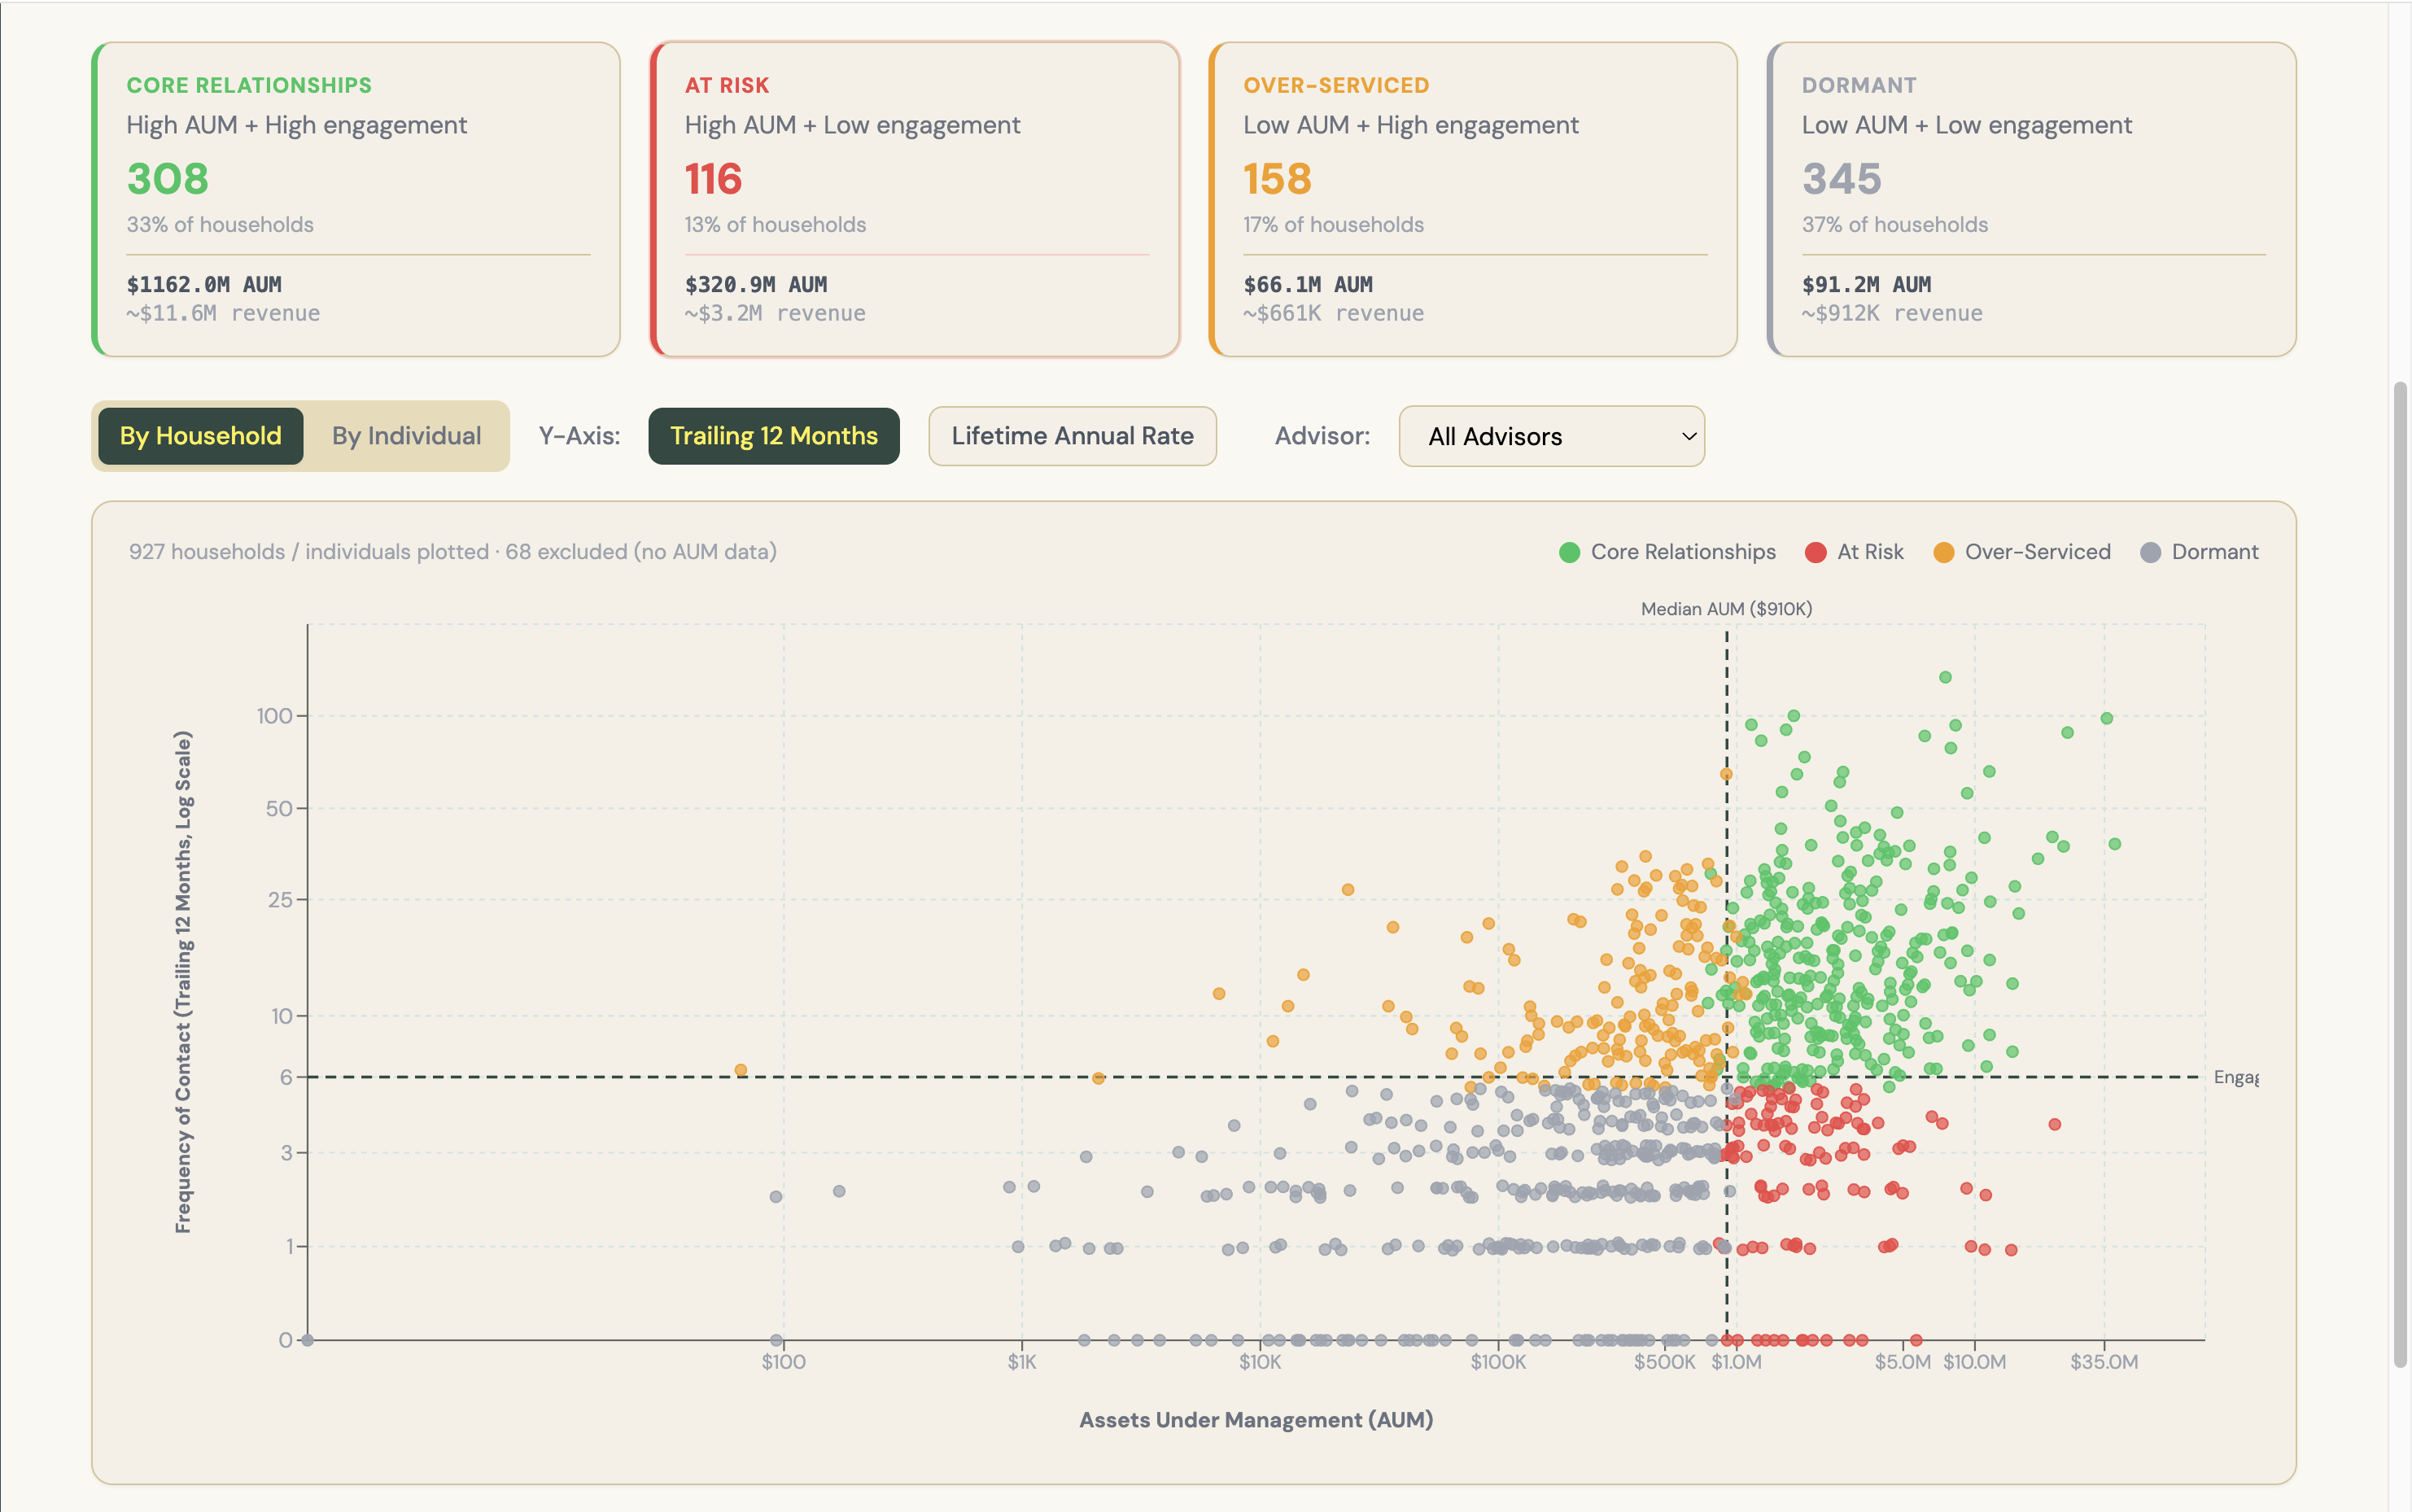
Client segmentation — AUM vs. engagement frequency with quadrant classification (Core, At Risk, Over-Serviced, Dormant) across 927 households
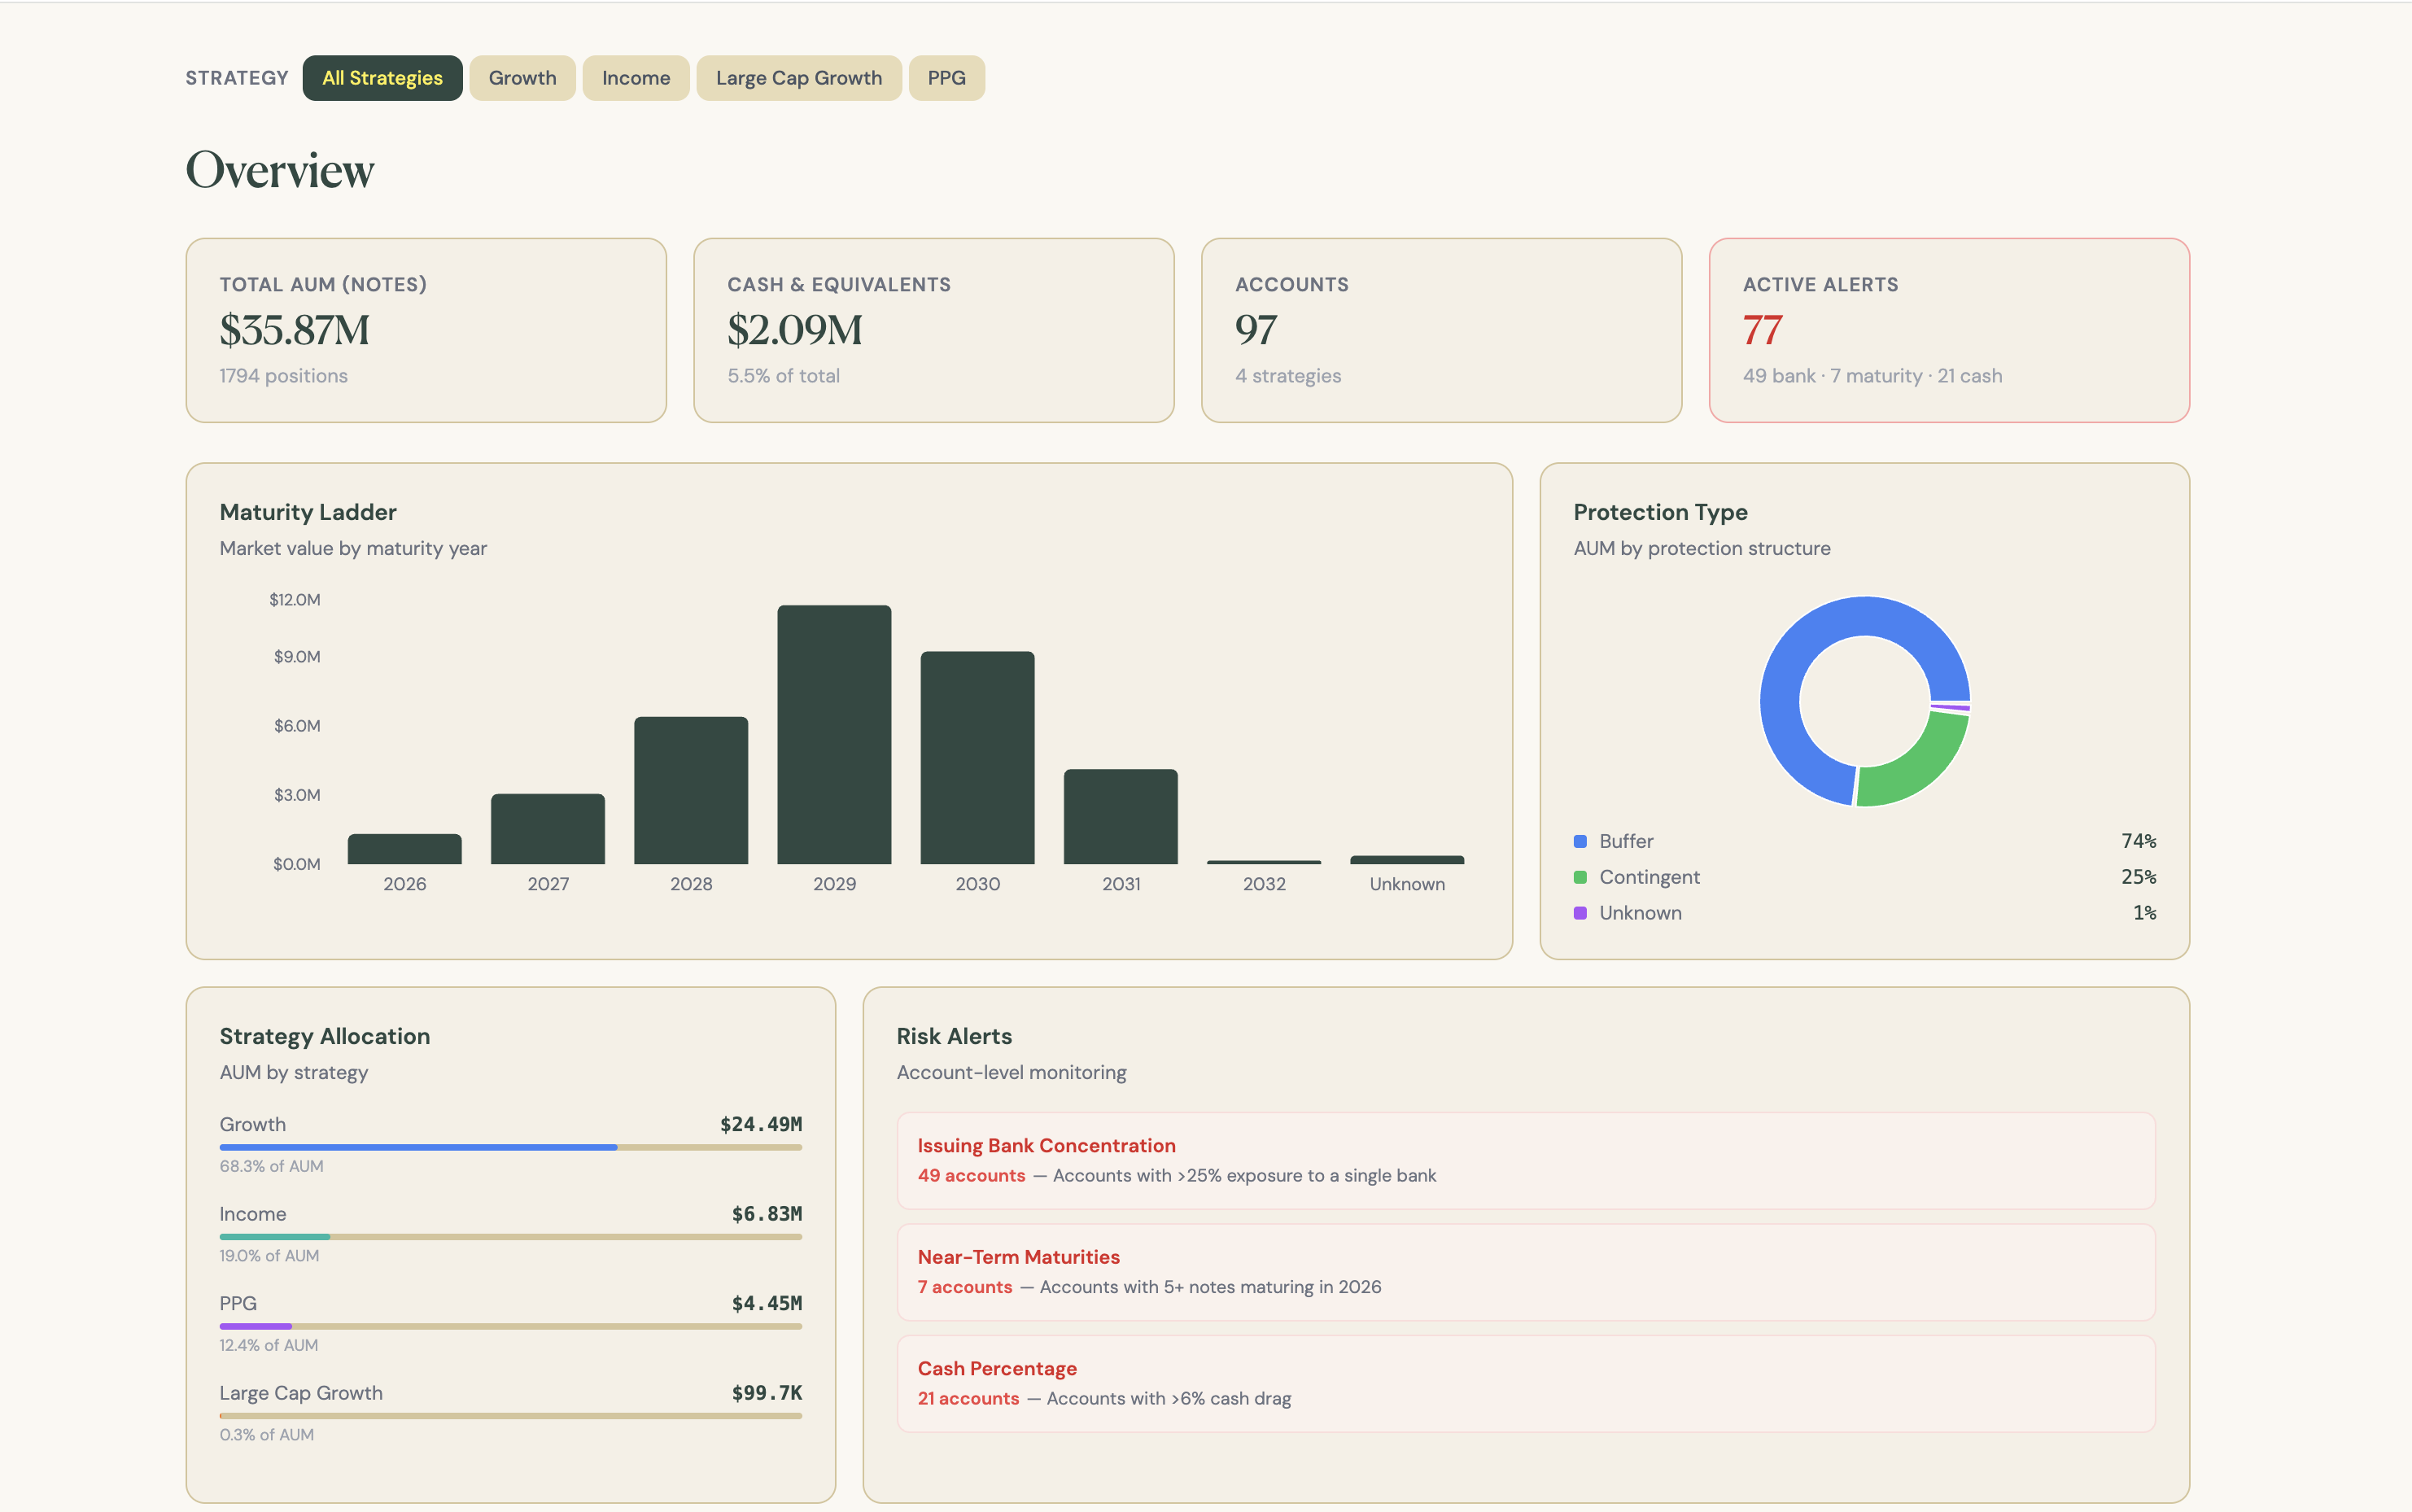
POPS dashboard — structured notes overview with maturity ladder, strategy allocation, protection types, and real-time risk alerts
Key Results
2 platforms → 1 unified SQL layer
17 Gold tables auto-synced nightly with schema evolution handled automatically.
Stale client visibility
2,775 active contacts scored by engagement recency — advisors immediately identified 1,104 clients with zero notes or reviews.
POPS risk monitoring
Real-time concentration alerts (>25% single bank exposure) across $37.3M in structured notes, replacing manual spreadsheet tracking.
Zero-downtime pipeline
Bronze/Silver/Gold layers with date fallback logic and incremental loading — no missed syncs from UTC midnight crossover.